CORONA Main Coronavirus thread

marsh

On TB every waking moment
When to start stocking up?
Now.
Just about everything nowadays is labeled as to country of origin.
From this article posted earlier this morning

The Global Supply & Demand Shock Of The Coronavirus

The Global Supply & Demand Shock Of The Coronavirus
Here is a look at the main manufacturing regions in China.
  • China Manufacturing Distribution Breakdown
  • Electronic Industry: Mainly in Guangdong (33%), the rest in Yangtze River delta, Sichuan, Shaanxi Provinces.
  • Textile Industry: Mainly in Zhejiang (18%) and Jiangsu (20%), the rest in Fujian, Guangdong, Shandong Provinces.
  • Leather & Feather: South-East Coastal areas, Hebei, Henan, Chongqing and Ningxia provinces.
  • Metal Product: Zhejiang, Guangdong, Jiangsu, Shandong, Hebei, Henan provinces.
  • Glass: More in Hebei, Jiangsu, some in Shandong and Guangdong provinces.
  • Ceramics: Jingdezhen in Jiangxi provinces
  • Furniture: Mainly in Guangdong and Hebei province, the rest in Jiangsu, Zhejiang, Shanghai, Chengdu and Beijing.
  • Construction: More in Shandong province, the rest in Hubei, Henan, Guangdong, Jiangsu, Beijing, Zhejiang.
  • Household Appliance: Guangdong, Zhejiang, Shandong provinces.
  • Artware & Stationary & Sporting: Zhejiang, Fujian, Guangdong, Hubei
  • Papermaking & Printing: Guangdong, Zhejiang, Jiangsu, Shandong, Fujian
  • Machinery Manufacturing: Dongbei Area, Hunan and Hubei provinces.
  • Petrochemical Industry: Shandong (32%), Liaoning (21%), Guangdong (15%)
  • Pharmaceutical Industry: Tianjin city, Xian city in Shanxi province
  • Food & Beverage: Liaoning, Shandong, Jiangsu, Guangdong, Fujian, Hebei, Henan, Hunan, Hubei, Inner Mongolia
  • Transportation Equipment:
    • Motor & Bicycle: Taizhou city in Zhejiang province (40%)
    • Shipping/Vessel: Yangtze River delta, Pearl River Delta, Bohai Bay Areas
    • Automobile: Mainly in Jilin, Hubei, Shanghai and Yangtze River delta, the rest in Pearl River Delta, Beijing
Most factories lose about two weeks of production in total during the Lunar Holiday but more production will be lost as the holiday has been extended.

__________
Glenn Beck reported that the city where steel is made had been shut down, so anything sourced there would also be effected.
https://www.zerohedge.com/users/tyler-durden
 

SmithJ

Veteran Member
here is the data point to watch for:

when Xi get it....
tumblr_d1747a4fc55a91a136909ca3f0363276_205e7f14_400.gif
 

Tristan

Has No Life - Lives on TB
Remaining ignorant is easy until it becomes painful.

I'm beginning to notice how often we agree on things... ;)


This is the rate of the very sick who have been hospitalized. It does not include all those who are infected but asymptomatic or have a lite case - at least not enough to be hospitalized. The death rate among all cases seems to be the high 2-4%.

It also does not take into account those who were very sick (or became so later) who were turned away from the hospital due to overcrowding or lack of screening test to verify they had the disease. It's possible they will have a higher mortality rate than those that were able to receive hospital care, but who knows...


BNO Newsroom
@BNODesk

2m

BREAKING: New coronavirus is now likely to become a pandemic, infectious disease experts say, adding that the mortality rate is not yet clear - New York Times


Yeah, no kidding? Who coudda knowd?

Geesh, we were there what, 2+ weeks ago?
 

marsh

On TB every waking moment
PW, you were referring to colleges and universities as potential loci of coronavirus. You were spot on; that's precisely what happened in my town--Tempe, home of Arizona State University, and U.S. nC0V Case #5.

I was looking at immigration statistics the other day. The Chinese are also being hired under work visas in the computer fields. Chinese Immigrants in the United States

Chinese Immigrants in the United States
JANUARY 15, 2020

By Carlos Echeverria-Estrada and Jeanne Batalova

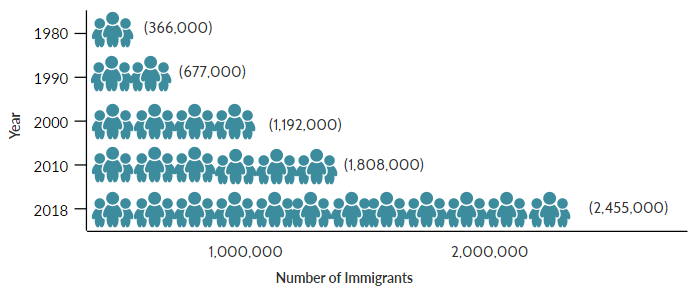
The population of Chinese immigrants in the United States has grown nearly seven-fold since 1980, reaching almost 2.5 million in 2018, or 5.5 percent of the overall foreign-born population. Whereas in 1980 Chinese immigrants did not appear among the ten largest foreign-born groups in the United States, China in 2018 replaced Mexico as the top sending country. After immigrants from Mexico and India, the Chinese represented the third largest group in the U.S. foreign-born population of nearly 45 million in 2018.

Chinese immigration in the United States has a long and fraught history. Throughout the first half of the 19th century, Chinese manual laborers (predominately men) migrated to the West Coast, where they found employment in agriculture, mining, railroad construction, and other low-skilled jobs. In response to negative public sentiments and organized labor lobbying, Congress in 1882 passed the Chinese Exclusion Act, the first legislation aimed at excluding certain foreigners based on their origin.

Political, economic, and legal developments in both countries during the next half century made it difficult for Chinese nationals either to leave China or to obtain a U.S. visa, stemming subsequent migration flows. The 1965 amendments to the Immigration and Nationality Act removed barriers for non-European immigration to the United States and created temporary worker programs for skilled workers. In contrast, nationals of Hong Kong did not face the same movement barriers as mainland Chinese and began arriving in the late 1960s. Chinese authorities relaxed emigration controls in 1978, and U.S.-China relations were normalized in 1979, beginning a second wave of Chinese migration to the United States.

The number of immigrants from China residing in the United States nearly doubled from 1980 to 1990, and again by 2000. Since then the population continued growing but at a slower pace (see Figure 1).

Figure 1. Chinese Immigrant Population in the United States, 1980-2018*
Chinese-SPT-Fig1_updated.png

* Estimates refer to immigrants from mainland China, Hong Kong, and Macau.
Sources: Data from U.S. Census Bureau 2010 and 2018 American Community Surveys (ACS), and 1980, 1990, and 2000 Decennial Census.

The Hong Kong-born population in the United States is far smaller than that from mainland China. There were 80,000 Hong Kong-born immigrants in the United States in 1980, a number that more than doubled to about 204,000 in 2000 and then increased slowly to 233,000 in 2018. Today, Hong-Kong born immigrants make up 10 percent of all Chinese immigrants residing in the United States.

China is the main source of foreign students enrolled in U.S. higher education, and its nationals received the second-largest number of employer-sponsored H-1B temporary visas in fiscal year 2018, after Indians. Chinese nationals received nearly half of EB-5 investor green cards in 2018.

The United States is the top destination for Chinese immigrants, accounting for almost 27 percent of the more than 12 million Chinese living outside of China, according to mid-2019 estimates by the United Nations Population Division. Other popular destinations include Canada (920,000), Japan (785,000), Australia (750,000), South Korea (620,000), and Singapore (451,000).

Click here to view an interactive map showing where migrants from China and other countries have settled worldwide.

Definitions
The U.S. Census Bureau defines the foreign born as individuals who had no U.S. citizenship at birth. The foreign-born population includes naturalized citizens, lawful permanent residents, refugees and asylees, legal nonimmigrants (including those on student, work, or other temporary visas), and persons residing in the country without authorization.
The terms foreign born and immigrant are used interchangeably and refer to those who were born in another country and later emigrated to the United States.

Unless otherwise stated, estimates for China include the People’s Republic of China, Hong Kong, and Macau, but exclude Taiwan.

Compared to the overall foreign- and native-born populations in the United States, Chinese immigrants are significantly better educated and more likely to be employed in management positions. Almost 30 percent of Chinese who obtain lawful permanent residence in the United States (also known as getting a green card) did so through employment-based routes; the remainder qualified through family ties or as asylees.

Using data from the U.S. Census Bureau (the most recent 2018 American Community Survey [ACS] and pooled 2014-18 ACS data), the Department of Homeland Security’s Yearbook of Immigration Statistics, and World Bank annual remittance data, this Spotlight provides information on the Chinese immigrant population in the United States, focusing on its size, geographic distribution, and socioeconomic characteristics.

Click on the bullet points below for more information:

Distribution by State and Key Cities

Roughly half of Chinese immigrants reside in just two states: California (32 percent) and New York (19 percent). The top four counties by concentration in the 2014-18 period were Los Angeles County, CA; Queens County, NY; Kings County, NY; and San Francisco County, CA. Together, these four counties accounted for one-quarter of the overall Chinese-born population in the United States.

Figure 2. Top Destination States for Chinese Immigrants in the United States, 2014-18
Chinese-SPT-Fig2.png

Note: Pooled 2014-18 ACS data were used to get statistically valid estimates at the state level for smaller-population geographies. Not shown are Chinese populations in Alaska and Hawaii, which are small in size; for details, visit the Migration Policy Institute (MPI) Data Hub for an interactive map showing geographic distribution of immigrants by state and county, available online.

Source: MPI tabulation of data from U.S. Census Bureau pooled 2014-18 ACS.
As of 2014-18, the greater New York City, San Francisco, and Los Angeles metropolitan areas had the largest number of Chinese immigrants. These three metro areas accounted for about 43 percent of Chinese immigrants.

Figure 3. Top Metropolitan Destinations for Chinese Immigrants in the United States, 2014-18
Chinese-SPT-Fig3.png

Note: Pooled 2014-18 ACS data were used to get statistically valid estimates at the metropolitan statistical-area level for smaller-population geographies.
Source: MPI tabulation of data from U.S. Census Bureau pooled 2014-18 ACS.
Table 1. Top Concentrations by Metropolitan Area for Chinese Immigrants, 2014-18
Chinese-SPT-Table1.png

Source: MPI tabulation of data from the U.S. Census Bureau pooled 2014-18 ACS.
Click here for an interactive map that highlights the metropolitan areas with the highest concentrations of immigrants. Select China from the dropdown menu.

English Proficiency

Chinese immigrants are less likely to be proficient in English and speak English at home than the overall U.S. foreign-born population. In 2018, about 58 percent of Chinese immigrants ages 5 and over reported limited English proficiency, compared to 47 percent of the total foreign-born population. Approximately 11 percent of Chinese immigrants spoke only English at home, compared to 17 percent of all immigrants.

Note: Limited English proficiency refers to those who indicated on the ACS questionnaire that they spoke English less than “very well.”

Age, Education, and Employment

On average, Chinese immigrants are of similar median age compared to the overall foreign-born population (median age of 45 years)—and both groups are older than the U.S.-born population (36 years). In 2018, Chinese immigrants were slightly less likely than the overall foreign-born population, but more likely than the native-born population, to be of working age (18 to 64; see Figure 4).

Figure 4. Age Distribution of the U.S. Population by Origin, 2018
Chinese-SPT-Fig4.png

Note: Numbers may not add up to 100 as they are rounded to the nearest whole number.
Source: MPI tabulation of data from the U.S. Census Bureau, 2018 ACS. Click here to view an interactive chart showing the age and sex distribution of top immigrant groups, including the Chinese born.

Chinese immigrants have considerably higher levels of educational attainment, especially in terms of advanced degrees, compared to the overall foreign- and U.S.-born populations. In 2018, about half of Chinese ages 25 and over had at least a bachelor’s degree, significantly higher than among immigrants overall and U.S.-born adults (32 percent and 33 percent, respectively). Notably, Chinese immigrants were more than twice as likely to have a graduate or professional degree compared to the other two groups (29 percent compared to 14 percent for all immigrants and 12 percent for the U.S. born).

This high educational attainment is linked to the specific channels through which Chinese immigrants enter the United States. In recent decades, many Chinese immigrants arrived either as international college students or high-skilled H-1B temporary workers (generally requiring a university degree). China is the leading sending country of international students in the United States: In the 2018-19 school year, close to 377,000 students from mainland China, Hong Kong, and Macau were enrolled in U.S. higher education institutions, according to the Institute of International Education. They accounted for about one-third of the 1 million international students studying in the United States. Approximately 46 percent of Chinese students were enrolled in science, technology, engineering, and math (STEM) fields. In FY 2018, Chinese citizens represented 12 percent of the 332,000 H-1B petitions (initial and continuing employment) approved by U.S. Citizenship and Immigration Services (USCIS), outnumbered only by Indian nationals, who accounted for 73 percent of those petitions.

Chinese immigrants participate in the labor force at a lower rate than the overall immigrant and native-born populations. In 2018, almost 60 percent of Chinese immigrants ages 16 and over were in the civilian labor force, compared to 66 percent and 62 percent of the total foreign- and native-born populations, respectively. More than half of Chinese immigrants were employed in management, business, science, and arts occupations versus 33 percent of the overall foreign-born and 40 percent of the native-born population.

Figure 5. Employed Workers in the Civilian Labor Force (ages 16 and older) by Occupation and Origin, 2018
Chinese-SPT-Fig5.png

Source:MPI tabulation of data from the U.S. Census Bureau 2018 ACS.
Income and Poverty

In 2018, Chinese immigrants had higher median household incomes compared to the overall foreign-born population: $70,000 compared to $60,000 (and $62,000 for native-born households)

Chinese immigrants were slightly more likely to live in families with annual incomes below the official poverty threshold (17 percent) compared to immigrants overall (15 percent) or the U.S. born (13 percent).

Immigration Pathways and Naturalization

In 2018, 53 percent of all Chinese immigrants in the United States were naturalized U.S. citizens, a share slightly higher than for the overall foreign-born population (51 percent).

Compared to all immigrants, Chinese immigrants are more likely to have arrived in the United States recently. Thirty-four percent of Chinese immigrants arrived in 2010 or later. Another 24 percent arrived between 2000 and 2009, and 42 percent before 2000 (see Figure 6).

Part 1 of 2
 

marsh

On TB every waking moment
Part 2 of 2

Figure 6. Immigrants from China and All Immigrants in the United States by Period of Arrival, 2018
Chinese-SPT-Fig6.png

Note: Numbers may not add up to 100 as they are rounded to the nearest whole number.
Source: MPI tabulation of data from the U.S. Census Bureau 2018 ACS.

In FY 2018, China was the third largest country of origin for new lawful permanent residents (LPRs, also known as green-card holders), after Mexico and Cuba. Approximately 67,000 (6 percent) of the nearly 1.1 million new LPRs were from mainland China, Hong Kong, or Macau. Compared to new green-card holders in general, Chinese immigrants were much more likely to use employment-based preferences (29 percent versus 13 percent of all LPRs; see Figure 7). In contrast, Chinese immigrants were less likely than new LPRs overall to obtain green cards as immediate relatives of U.S. citizens (37 percent, compared to 44 percent).

There are significant backlogs for mainland Chinese applying for LPR status through employment-based and family-sponsored channels, due to the annual per-country cap on the number of immigrant visas available for these categories. According to the most recent visa issuance data, in January 2020 the State Department was processing family-sponsored green-card applications that had been filed by Chinese applicants well more than a decade earlier: February 2007 for those with family-linked visas and April 2008 for those with employment-related applications.

Figure 7. Immigration Pathways of Chinese Immigrants and All Immigrants in the United States, 2018
Chinese-SPT-Fig7.png

Notes: Family-sponsored: Includes adult children and siblings of U.S. citizens as well as spouses and children of green-card holders. Immediate relatives of U.S. citizens: Includes spouses, minor children, and parents of U.S. citizens. Diversity Visa Lottery: The Immigration Act of 1990 established the Diversity Visa Lottery to allow entry to immigrants from countries with low rates of immigration to the United States. The law states that 55,000 diversity visas in total are made available each fiscal year. While individuals born in mainland China are not eligible for the lottery, those from Hong Kong and Macau are eligible.

Source: MPI tabulation of data from Department of Homeland Security (DHS), 2018 Yearbook of Immigration Statistics (Washington, DC: DHS Office of Immigration Statistics, 2019), available online.

Although most Chinese immigrants in the United States are legally present, approximately 362,000 were unauthorized in 2016, according to Migration Policy Institute (MPI) estimates, comprising around 3 percent of the 11.3 million unauthorized immigrants in the United States.

The Deferred Action for Childhood Arrivals (DACA) program provides temporary reprieve from deportation and work authorization to qualified unauthorized immigrants who came to the United States as children. As of April 30, 2019, 780 of the approximately 669,000 DACA recipients were born in China or Hong Kong.

Health Coverage

Chinese immigrants are more likely to have private health insurance than the overall foreign-born population, and less likely to be covered by public health insurance programs (see Figure 8). Chinese immigrants are also less than half as likely to be uninsured, compared to the overall immigrant population.

Figure 8. Health Coverage for Chinese Immigrants, All Immigrants, and the Native Born, 2018
Chinese-SPT-Fig8.png

Note: The sum of shares by type of insurance is likely to be greater than 100 because people may have more than one type of insurance.
Source: MPI tabulation of data from the U.S. Census Bureau, 2018 ACS.
Diaspora

The Chinese diaspora in the United States is comprised of approximately 5.5 million individuals who were either born in China or reported Chinese ancestry or race, according to 2018 Census Bureau tabulations.

Remittances

Remittances to mainland China have regained momentum since 2016, making the country the second-largest global recipient of remittances (after India). In 2019, mainland China took in an estimated $70 billion in remittances via formal channels, its highest ever recorded. Remittances represented less than 1 percent of China’s gross domestic product (GDP) in 2019.

Figure 9. Annual Remittance Flows to Mainland China, 1982 to 2019
Chinese-SPT-Fig9.png

Source: MPI tabulations of data from the World Bank Prospects Group, “Annual Remittances Data,” October 2019 update.
Visit the Data Hub’s collection of interactive remittances tools, which track remittances by inflow and outflow, between countries, and over time.

Sources

Knapp, Anthony. 2019. Net International Migration Projected to Fall to Lowest Levels This Decade. United States Census Bureau, December 20, 2019. Available online.

Institute of International Education. N.d. Open Doors 2019. Accessed January 3, 2020. Available online.

United Nations Population Division. N.d. International Migrant Stock by Destination and Origin. Accessed January 2, 2020. Available online.

U.S. Census Bureau. N.d. 2019 American Community Survey (ACS). Explore Census Data. Accessed January 3, 2020. Available online.

---. 2019. 2018 ACS. Accessed from Steven Ruggles, Katie Genadek, Ronald Goeken, Josiah Grover, and Matthew Sobek. Integrated Public Use Microdata Series: Version 6.0 [Machine-readable database]. Minneapolis: University of Minnesota, 2019. Available online.

U.S. Citizenship and Immigration Services (USCIS). 2019. Characteristics of H-1B Specialty Occupation Workers: Fiscal Year 2018 Annual Report to Congress. Washington, DC: USCIS. Available online.

U.S. Department of Homeland Security (DHS) Office of Immigration Statistics. N.d. 2018 Yearbook of Immigration Statistics. Accessed January 3, 2020. Available online.

U.S. Department of State. 2020. Visa Bulletin for January 2020. Available online.

World Bank Prospects Group. 2017. Annual Remittances Data. Updated October 2019. Available online.
 

mzkitty

I give up.
Oh yippee. :rolleyes:


1580686407995.png


Doomer Doug

TB Fanatic
Hmm, I am watching the Super Bowl and can't mentally connect with these "Americans involved with it. I am wondering if they realize how much danger they are in? The Turkish airline ad banner during the pre game, like didn't Erdogan have his thugs rape and murder Kurds and in Libya too? I went shopping which saw not one single sign the Sheeple are getting it at all. One super shredder in the Super bowl and kaput. Chinese are all over Portland, students and tourists who are in no hurry to go back to china, at least until the money runs out. DUCK AND COVER. One more thing duck search engine is better than Google and bing are.
 

Tristan

Has No Life - Lives on TB

bluelady

Veteran Member
I actually believe it did break loose in the "fish" market. As we are talking about China, some idiot who was to dispose of the bats, probably saw a chance to make some money and decided to sell the infected bats at that market.

The others who got infected without being there? Who knows, maybe they came into contact with the idiot at some point.
Did they sell those infected animals at other markets also? Or animals from the market ended up in a restaurant farther away? Rhetorical questions, obviously. I still do believe this is a highly likely scenario.
 

zeker

Has No Life - Lives on TB
my bro has a few cases of n95 masks

he put them on Kijiji (like craigs list but Canada)

guy came and bot a cpl cases

says they are for his daughter

she is a nurse on Toronto and her hosp has none

wtf

this crap just barely started and no masks??

guy mite be back for the white coveralls
 

naturallysweet

Has No Life - Lives on TB
Oh yippee. :rolleyes:


View attachment 181445

How long after they are 'cured', does the virus exist in a person and their poop?
 

bluelady

Veteran Member
Same here. I think on the first couple pages I had posted about someone from my Chicago office that had a business trip planned to China. I was talking to her about the flu. Next thing you know my boss is like stop it you're scaring her. I say nothing for over a week and then guess what- she texted me to say they had cancelled her trip (this was before flights were cancelled).

I have a small stash of masks and gloves. I had more and didn't know DD was using them for her crafts! :mad: I'm not overly concerned because I do have my stash but thought I'll pickup a few more. Nope- went to Walmart, 2 dollar stores, 3 Walgreens, Smith's, and CVS. not a mask to be found.

I'm like you I just shut up and keep track of my preps. Which are now locked up. DD said she was sorry but I explained to her ASK before using anything.
Our Home Depot still had lots of masks; the few Walmart had were gone.
 

Texican

Live Free & Die Free.... God Freedom Country....
It will also get in the sewer systems and from there the waterways. I don't know how long it's viable

Depending on the nation and cities, sewage has the potential to infect the plant personnel, but the effluent is general treated with chlorine to kill the pathogens that make it through the treatment process....

The unasked question:

Is all of the contaminated disposal hospital material incinerated or just dumped in a landfill????

Texican....
 

bsharp

Veteran Member
I am still a few pages behind, but the thought crossed my mind about their electrical grid. Have they had any power problems? No people to run it? Or is that one job that is allowed to continue as long as they are still not sick? Any news on that?
 

mzkitty

I give up.
Depending on the nation and cities, sewage has the potential to infect the plant personnel, but the effluent is general treated with chlorine to kill the pathogens that make it through the treatment process....

The unasked question:

Is all of the contaminated disposal hospital material incinerated or just dumped in a landfill????

Texican....

I don't know that either, but I would hope it would be burned.
 

Dozdoats

On TB every waking moment

Coronavirus Geometric Progression Suggests 100,000 Infections in a Week
https%3A%2F%2Fs3-us-west-2.amazonaws.com%2Fmaven-user-photos%2Fmishtalk%2Feconomics%2FzmfATcSa4EegwR7v_znq6Q%2FVGObaSoLPk2t6x19vEuC0Q

Mish
Jan 28, 2020
https%3A%2F%2Fmaven.io%2Fapi%2Fuser%2FzmfATcSa4EegwR7v_znq6Q%2Fphoto%3Fversion%3D1602842

Bianco Research mapped out the geometric progression of coronavirus cases. We are on track for 100K in a week.
Jim Bianco shared some of his coronavirus research with me yesterday. I asked if he would make the article public.
Thanks to Bianco please consider Coronavirus Growth Rates and Market Reactions.
This is a guest post courtesy of Bianco Research
Summary

The growth in coronavirus infections has continued along a geometric progression for the last 12 days. Should it continue along this path, infection cases could approach 100,000 in a week.
Comments
The following charts were constructed from the daily update from the National Health Commission of the People’s Republic of China.


The blue line in the chart below shows the actual number of reported coronavirus cases stands at 4,515 as of January 27.

The orange line is a simple progression that assumes a 53% increase in the cases every day. Or, one person infects 2 to 2.5 people. So it is a simple multiplier, nothing more. This is known as R0 (R-Naught), or the infection rate. Note the chart is a log scale.
The reported number of infections perfectly track this simple multiplier. This is how viral inflections growth, along a geometric path.
If this track is not altered, the number of reported cases will top 16,000 by Friday.


To many, such a geometric progression is alarming (see the tweet immediately above).
As the orange line shows, this type of growth rate would suggest 80,000+ infections next Monday and 138 million by February 20.
Is this growth rate possible? Over the near-term yes.
The National Health Commission of the People’s Republic of China offers another statistic, the number of people in quarantine suspected of having the coronavirus. As of January 27, over 44,000 are quarantined. Many of these people will unfortunately be reported as infected.


To be absolutely clear, this is NOT a prediction that 100 million people will be infected by Feb 20. Rather, this has been its growth rate for the last 12 days. A vaccine, mutation or successful quarantine/isolation could help reduce this growth rate.

Market Implications
Mongolia and North Korea have already closed their border with China. Hong Kong is restricting its border. As cases continue to emerge in Japan and outside of Asia, calls will grow for the Chinese to engage in drastic action to stop its spread.
This potentially means Chinese businesses will halt, flights will stop (see the plunge in crude oil on oversupply worries) and the global supply chain will grind to a halt. This could have enormous economic consequences for global growth.
While not overlooking the human tragedy, the markets have the difficult task of pricing an event that has a small chance of being devastating to global growth, but a more likely outcome of being contained. Yesterday’s selloff in stocks was likely a response to the fact that this virus has continued to grow at a geometric pace thus far. In trying to quantify the market impact, perhaps these charts offer one way to gauge the severity of this virus in the days ahead.
End Guest Post
Here is another link echoing Bianco's market concerns.


Thanks to Jim Bianco for these charts. He has a couple more including one on death rates that I did not copy.
 

marsh

On TB every waking moment
California Faces Third Case of Coronavirus, and a New Quarantine (A link from the other NYT article)

California Faces Third Case of Coronavirus, and a New Quarantine
The federal government imposed a quarantine on 195 people who arrived on an evacuation flight from China, raising questions about the state’s vulnerability in the outbreak.


merlin_168061293_2efe7cc4-541b-402a-810f-9b02bf328ba4-articleLarge.jpg


Airline employees wore face masks to protect against the spread of the Wuhan coronavirus at Los Angeles International Airport earlier this week.Credit...Mark Ralston/Agence France-Presse — Getty Images
Thomas Fuller
By Thomas Fuller
  • Jan. 31, 202
[Sign up for our daily newsletter about news from California.]
SAN FRANCISCO — A third confirmed case of coronavirus in California was announced on Friday, raising new questions about the state’s vulnerability in the outbreak on the same day the federal government imposed a 14-day quarantine for the 195 people who arrived on an evacuation flight from Wuhan, China.

The federal government also announced that foreign nationals who have traveled to China will temporarily not be allowed to enter the United States; that restriction does not apply to immediate family of American citizens and permanent residents.

The quarantine in California will keep the group at the March Air Reserve Base in Riverside for 14 days to make sure nobody is infected with the coronavirus, the authorities said. In a sign of the heightened precautions against contagion, the flight crew on the aircraft that evacuated the group from China wore hazmat suits.

Though the disease has killed more than 200 people worldwide, the outbreak remains limited in the United States. So far, seven people are known to be infected with the virus in the country, including three people in California.

As Virus Spreads, U.S. Temporarily Bars Foreigners Who’ve Visited China
Jan. 31, 2020

The three confirmed cases were in Los Angeles, Orange and Santa Clara Counties.
In Los Angeles County, the infected person reported to authorities that he was feeling unwell as he was traveling back to Wuhan, China, the center of the outbreak. The patients in Orange County and Santa Clara County had also traveled to Wuhan.

The Santa Clara County case was announced by Dr. Sara Cody, the county’s health officer, on Friday.

“This is the first case in Santa Clara and in the Bay Area,” she said. “We are currently reaching out to anyone he may have come into contact with.”

Dr. Cody said that after returning from China on Jan. 24 and becoming ill, the patient was “careful to isolate at home.” She said he had only left his home to seek treatment for his illness.
“We are actually quite lucky in this case,” Dr. Cody said. “I think the contact list will be short.”

Dr. Cody said that the patient had flown into the San Jose airport and that her office had forwarded the details of his flights to the Centers for Disease Control and Prevention.

Wuhan Coronavirus
  • Impact in the U.S.
    Updated Jan. 31, 2020
    • There have been seven confirmed cases in the U.S., but no deaths. Anxiety is intense on college campuses.
    • The 195 Americans who were evacuated from Wuhan to California have been quarantined as one person tried to flee.
    • If you live in California, here’s what this means for you.
    • President Trump has temporarily suspended entry into the U.S. for any foreign nationals who have traveled to China.
    • Delta, United and American Airlines are suspending service from the U.S. and China.
Sonia Angell, director of the California Department of Public Health, said in a recorded video message this week that the health risk to the general public in California was low. “But we still consider this a serious public health concern,” Dr. Angell said. Around 40 people in California have been tested for the disease, according to the department.

But understanding the specific risks to the state center on questions that have not yet been answered: How transmissible is the disease? And how long is its incubation period? Estimates of the incubation period range from two days to two weeks.

How Bad Will the Coronavirus Outbreak Get? Here Are 6 Key Factors
Here’s what early research says about how the pathogen behaves and the factors that will determine whether it can be contained.

Airlines are canceling flights between the U.S. and China.
Christine Kreuder Johnson, an infectious disease expert at the University of California, Davis, says California is more vulnerable than some other places in the United States because of the large number of people in the state traveling back and forth to China.

“It does put us right on that front line,” she said.

Many flights from China entered the state before the disease was recognized and screenings at the San Francisco, Los Angeles and New York airports were put into place on Jan 17.

It is an open question, Dr. Johnson said, whether any passengers on the earlier flights were infected and transmitted the disease to others.

On Friday, Delta Air Lines, United Airlines and American Airlines said they were suspending all service to mainland China.

The current guidance from the C.D.C. is for travelers from China to watch their health for 14 days after arriving.

Dr. Johnson said she was optimistic based on the previous outbreaks like SARS that the coronavirus can be extinguished.

“There is good hope for it to be controlled,” she said.

As Virus Spreads, U.S. Temporarily Bars Foreigners Who’ve Visited China
Jan. 31, 2020

Almost 200 people are under quarantine at the military base.
Among the 195 people quarantined on the military base in Southern California were diplomats, infants, a football player and a theme-park designer.

Their flight was the only one organized by the State Department leaving Wuhan.

“It’s not Club Med, but we’re fortunate to be here,” said Matthew McCoy, the theme-park designer who lives in Shanghai but was in Wuhan working on a mall he is refashioning. “I try to stay busy with my work, social media and my hotel workout regimen.”

The evacuees have their temperatures taken regularly and their noses swabbed. They have been advised against shaking hands or hugging.

Inside the California Military Base a Coronavirus Evacuee Tried to Flee
Jan. 30, 2020


Colleges are taking precautions, and some events have been called off.
While the spread of the disease has been limited in California, it has already had a social impact.

College students from mainland China as well as Americans in California of East Asian descent are reporting suspicious glances on public transport and rising xenophobia.

At the University of California, Berkeley, which has a large Chinese student population, officials apologized after the university health center posted an image that included “xenophobia” among a list of “common reactions” to the coronavirus. It was condemned as giving legitimacy to racism.

Dr. Stacie San Miguel, the director of medical services at the University of California, San Diego’s student health center, said students and others had been flocking to physicians for checkups.

“Especially the people who have been to China and had a runny nose, they’re not sure — is this something or not something? — so there has been some anxiety,” Dr. San Miguel said.
In Northern California, multiple cities canceled their Lunar New Year celebrations, including Stockton and Elk Grove.

Masks Are On. Games Are Canceled. Fear of the Coronavirus Comes to U.S. Colleges.
Jan. 31, 2020

Nicholas Bogel-Burroughs contributed reporting from New York, and Miriam Jordan from Los Angeles.
 

ainitfunny

Saved, to glorify God.
What I saw today was the LEADER OF CHINA -Xi Jinping coughing!

I don't know who would replace him if he fell victim to coronavirus, and since their leaders seem to have such absolute power, it could be a VERY different China under another leader.
That gives me pause to consider what else might come of it.
 

bw

Fringe Ranger
I am still a few pages behind, but the thought crossed my mind about their electrical grid. Have they had any power problems? No people to run it? Or is that one job that is allowed to continue as long as they are still not sick? Any news on that?

We're out on the end of a line, and if the power goes out near us with sketchy repair crew staffing, we won't be back for a while. I'm going to build a second battery box. We also have solar panels and two generators, but the more the merrier.
 

mzkitty

I give up.
Hmmm, they're calling that new prefab hospital "Vulcan Mountain." Couldn't name it like rose of spring or something, am I right?


1580690296093.png

Translation under #beauties_life:

Video of Vulcan Mountain
The interior of the room is small
There is a small window for food delivery
The door can only be opened from the outside

---------------------------------

Hmmm, Vulcan Mountain sounds ominous, like a crematorium..............

1580690537016.png

Video of hospital:

View: https://www.youtube.com/watch?v=SaSZewfc4z0


http://www.youtube.com/watch?v=SaSZewfc4z0
 

Trivium Pursuit

Has No Life - Lives on TB

Coronavirus Geometric Progression Suggests 100,000 Infections in a Week
https%3A%2F%2Fs3-us-west-2.amazonaws.com%2Fmaven-user-photos%2Fmishtalk%2Feconomics%2FzmfATcSa4EegwR7v_znq6Q%2FVGObaSoLPk2t6x19vEuC0Q

Mish
Jan 28, 2020
https%3A%2F%2Fmaven.io%2Fapi%2Fuser%2FzmfATcSa4EegwR7v_znq6Q%2Fphoto%3Fversion%3D1602842

Bianco Research mapped out the geometric progression of coronavirus cases. We are on track for 100K in a week.
Jim Bianco shared some of his coronavirus research with me yesterday. I asked if he would make the article public.
Thanks to Bianco please consider Coronavirus Growth Rates and Market Reactions.
This is a guest post courtesy of Bianco Research
Summary

The growth in coronavirus infections has continued along a geometric progression for the last 12 days. Should it continue along this path, infection cases could approach 100,000 in a week.
Comments
The following charts were constructed from the daily update from the National Health Commission of the People’s Republic of China.


The blue line in the chart below shows the actual number of reported coronavirus cases stands at 4,515 as of January 27.

The orange line is a simple progression that assumes a 53% increase in the cases every day. Or, one person infects 2 to 2.5 people. So it is a simple multiplier, nothing more. This is known as R0 (R-Naught), or the infection rate. Note the chart is a log scale.
The reported number of infections perfectly track this simple multiplier. This is how viral inflections growth, along a geometric path.
If this track is not altered, the number of reported cases will top 16,000 by Friday.


To many, such a geometric progression is alarming (see the tweet immediately above).
As the orange line shows, this type of growth rate would suggest 80,000+ infections next Monday and 138 million by February 20.
Is this growth rate possible? Over the near-term yes.
The National Health Commission of the People’s Republic of China offers another statistic, the number of people in quarantine suspected of having the coronavirus. As of January 27, over 44,000 are quarantined. Many of these people will unfortunately be reported as infected.


To be absolutely clear, this is NOT a prediction that 100 million people will be infected by Feb 20. Rather, this has been its growth rate for the last 12 days. A vaccine, mutation or successful quarantine/isolation could help reduce this growth rate.

Market Implications
Mongolia and North Korea have already closed their border with China. Hong Kong is restricting its border. As cases continue to emerge in Japan and outside of Asia, calls will grow for the Chinese to engage in drastic action to stop its spread.
This potentially means Chinese businesses will halt, flights will stop (see the plunge in crude oil on oversupply worries) and the global supply chain will grind to a halt. This could have enormous economic consequences for global growth.
While not overlooking the human tragedy, the markets have the difficult task of pricing an event that has a small chance of being devastating to global growth, but a more likely outcome of being contained. Yesterday’s selloff in stocks was likely a response to the fact that this virus has continued to grow at a geometric pace thus far. In trying to quantify the market impact, perhaps these charts offer one way to gauge the severity of this virus in the days ahead.
End Guest Post
Here is another link echoing Bianco's market concerns.


Thanks to Jim Bianco for these charts. He has a couple more including one on death rates that I did not copy.
This article is important because of the very 1st graph. It shows that the rate of increase of the virus has actually reduced. If the rate of infection increase had continued, the graph said there would be over 35000 as of yesterday. As of right now, its 17200. So it's still on the rise, but at least it's fallen off of that log line that it had. These still are the Chinese numbers, but improvement would be nice to see.
 

bw

Fringe Ranger
This article is important because of the very 1st graph. It shows that the rate of increase of the virus has actually reduced. If the rate of infection increase had continued, the graph said there would be over 35000 as of yesterday. As of right now, its 17200. So it's still on the rise, but at least it's fallen off of that log line that it had. These still are the Chinese numbers, but improvement would be nice to see.

These still are the Chinese numbers. That's really all that needs to be said.
 
Top